#!/bin/bash
# @Function
# Find out the highest cpu consumed threads of java, and print the stack of these threads.
#
# @Usage
#   $ ./show-busy-java-threads.sh
#
# @author Jerry Lee

readonly PROG=`basename $0`
readonly -a COMMAND_LINE=("$0" "$@")

usage() {
    cat <<EOF
Usage: ${PROG} [OPTION]...
Find out the highest cpu consumed threads of java, and print the stack of these threads.
Example: ${PROG} -c 10

Options:
    -p, --pid       find out the highest cpu consumed threads from the specifed java process,
                    default from all java process.
    -c, --count     set the thread count to show, default is 5
    -h, --help      display this help and exit
EOF
    exit $1
}

readonly ARGS=`getopt -n "$PROG" -a -o c:p:h -l count:,pid:,help -- "$@"`
[ $? -ne 0 ] && usage 1
eval set -- "${ARGS}"

while true; do
    case "$1" in
    -c|--count)
        count="$2"
        shift 2
        ;;
    -p|--pid)
        pid="$2"
        shift 2
        ;;
    -h|--help)
        usage
        ;;
    --)
        shift
        break
        ;;
    esac
done
count=${count:-5}

redEcho() {
    [ -c /dev/stdout ] && {
        # if stdout is console, turn on color output.
        echo -ne "\033[1;31m"
        echo -n "$@"
        echo -e "\033[0m"
    } || echo "$@"
}

yellowEcho() {
    [ -c /dev/stdout ] && {
        # if stdout is console, turn on color output.
        echo -ne "\033[1;33m"
        echo -n "$@"
        echo -e "\033[0m"
    } || echo "$@"
}

blueEcho() {
    [ -c /dev/stdout ] && {
        # if stdout is console, turn on color output.
        echo -ne "\033[1;36m"
        echo -n "$@"
        echo -e "\033[0m"
    } || echo "$@"
}

# Check the existence of jstack command!
if ! which jstack &> /dev/null; then
    [ -z "$JAVA_HOME" ] && {
        redEcho "Error: jstack not found on PATH!"
        exit 1
    }
    ! [ -f "$JAVA_HOME/bin/jstack" ] && {
        redEcho "Error: jstack not found on PATH and $JAVA_HOME/bin/jstack file does NOT exists!"
        exit 1
    }
    ! [ -x "$JAVA_HOME/bin/jstack" ] && {
        redEcho "Error: jstack not found on PATH and $JAVA_HOME/bin/jstack is NOT executalbe!"
        exit 1
    }
    export PATH="$JAVA_HOME/bin:$PATH"
fi

readonly uuid=`date +%s`_${RANDOM}_$$

cleanupWhenExit() {
    rm /tmp/${uuid}_* &> /dev/null
}
trap "cleanupWhenExit" EXIT

printStackOfThreads() {
    local line
    local count=1
    while IFS=" " read -a line ; do
        local pid=${line[0]}
        local threadId=${line[1]}
        local threadId0x="0x`printf %x ${threadId}`"
        local user=${line[2]}
        local pcpu=${line[4]}

        local jstackFile=/tmp/${uuid}_${pid}

        [ ! -f "${jstackFile}" ] && {
            {
                if [ "${user}" == "${USER}" ]; then
                    jstack ${pid} > ${jstackFile}
                else
                    if [ $UID == 0 ]; then
                        sudo -u ${user} jstack ${pid} > ${jstackFile}
                    else
                        redEcho "[$((count++))] Fail to jstack Busy(${pcpu}%) thread(${threadId}/${threadId0x}) stack of java process(${pid}) under user(${user})."
                        redEcho "User of java process($user) is not current user($USER), need sudo to run again:"
                        yellowEcho "    sudo ${COMMAND_LINE[@]}"
                        echo
                        continue
                    fi
                fi
            } || {
                redEcho "[$((count++))] Fail to jstack Busy(${pcpu}%) thread(${threadId}/${threadId0x}) stack of java process(${pid}) under user(${user})."
                echo
                rm ${jstackFile}
                continue
            }
        }
        blueEcho "[$((count++))] Busy(${pcpu}%) thread(${threadId}/${threadId0x}) stack of java process(${pid}) under user(${user}):"
        sed "/nid=${threadId0x} /,/^$/p" -n ${jstackFile}
    done
}


ps -Leo pid,lwp,user,comm,pcpu --no-headers | {
    [ -z "${pid}" ] &&
    awk '$4=="java"{print $0}' ||
    awk -v "pid=${pid}" '$1==pid,$4=="java"{print $0}'
} | sort -k5 -r -n | head --lines "${count}" | printStackOfThreads
Tuesday, February 14, 2017
Find out the highest cpu consumed threads of java, and print the stack of these threads.


Identify Java code consuming high CPU in Linux (linking JVM thread and Linux PID)
We can easily identify a problematic java code which leads to high CPU utilization in Linux. Let me explain the steps with the following example,
- package test;
- public class ThreadDumpTest {
- public void test(){
- for (int i = 0; i < 10 ; i++) {
- Thread th=new Thread(new TR(i));
- th.setName(“MyThread-“+(1000+i));
- th.start();
- }
- }
- public static void main(String[] args) {
- ThreadDumpTest t=new ThreadDumpTest();
- t.test();
- }
- private class TR implements Runnable{
- int ins=0;
- TR(int i){
- ins=i;
- }
- public void run(){
- while (true) {
- if(ins!=5) {
- try {
- Thread.sleep(10000);
- } catch (Exception e) {
- e.printStackTrace();
- }
- }
- }
- }
- }
- }
In the above example, all the threads are in while loop. Except ‘MyThread-1005‘ thread, all other threads will sleep 10 secs inside the loop. The ‘MyThread-1005‘ thread will not enter sleep part, so it will run in while loop without sleep. Due to while loop, the ‘MyThread-1005‘ thread will leads to high CPU utilization.
How to identify ?
Step 1 :
Execute ‘top‘ command on the console. You can see the ‘java’ command with PID 7074 utilized 97% of CPU.
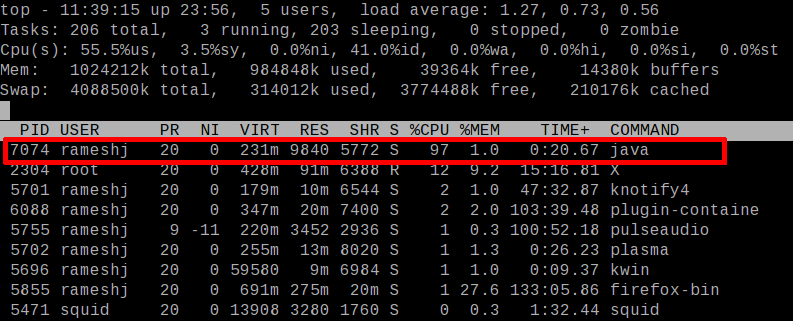
Step 2 :
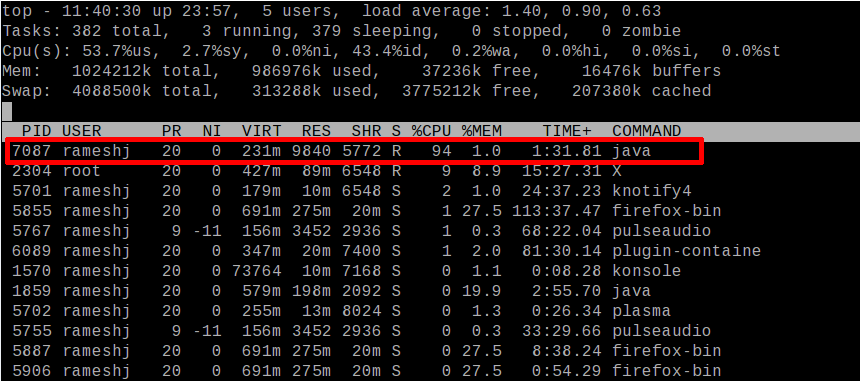
The top command displays the process list like the above image. Press ‘Shift + h‘ and wait few secs. You can see ‘Show threads on‘ message in the top console. Now, you can see thread level details like CPU/Memory utilization. You can see a ‘java’ command thread with PID 7087 utilized 94% of CPU.
Step 3:
The identified problematic thread PID ( 7087 ) is in decimal format. Convert it into hexadecimal format. The respective hexadecimal for 7087 is 1BAF. And convert it into lowercase (1baf ).
Step 4:
Take thread dump and search the converted hexadecimal PID ( 1baf ) in the thread dump. You can find the hex PID as ‘nid‘ (with ‘0x’) of the thread trace. From the trace, you can find ‘MyThread-1005‘ is the problematic thread in the test program. And using the thread trace you can identify the problematic code and fix the problem.
- [rameshj@rameshj thread]$ java test/ThreadDumpTest
- ^\Full thread dump Java HotSpot(TM) Client VM (1.5.0_06-b05 mixed mode):
- “DestroyJavaVM” prio=1 tid=0x083d2d78 nid=0x1ba2 waiting on condition [0x00000000..0xbff4bf60]
- “MyThread-1009” prio=1 tid=0x08510a88 nid=0x1bb3 waiting on condition [0xa9cca000..0xa9ccb020]
- at java.lang.Thread.sleep(Native Method)
- at test.ThreadDumpTest$TR.run(ThreadDumpTest.java:45) &nbs
p; - at java.lang.Thread.run(Thread.java:595)
- “MyThread-1008” prio=1 tid=0x08510318 nid=0x1bb2 waiting on condition [0xa9d4b000..0xa9d4bea0]
- at java.lang.Thread.sleep(Native Method)
- at test.ThreadDumpTest$TR.run(ThreadDumpTest.java:45)
- at java.lang.Thread.run(Thread.java:595)
- “MyThread-1007” prio=1 tid=0x0850f298 nid=0x1bb1 waiting on condition [0xa9dcc000..0xa9dccf20]
- at java.lang.Thread.sleep(Native Method)
- at test.ThreadDumpTest$TR.run(ThreadDumpTest.java:45)
- at java.lang.Thread.run(Thread.java:595)
- “MyThread-1006” prio=1 tid=0x0850d818 nid=0x1bb0 waiting on condition [0xa9e4d000..0xa9e4dda0]
- at java.lang.Thread.sleep(Native Method)
- at test.ThreadDumpTest$TR.run(ThreadDumpTest.java:45)
- at java.lang.Thread.run(Thread.java:595)
- “MyThread-1005” prio=1 tid=0x0850c9f8 nid=0x1baf runnable [0xa9ece000..0xa9ecee20]
- at test.ThreadDumpTest$TR.run(ThreadDumpTest.java:43)
- at java.lang.Thread.run(Thread.java:595)
- “MyThread-1004” prio=1 tid=0x0850b8e8 nid=0x1bae waiting on condition [0xa9f4f000..0xa9f500a0]
- at java.lang.Thread.sleep(Native Method)
- at test.ThreadDumpTest$TR.run(ThreadDumpTest.java:45)
- at java.lang.Thread.run(Thread.java:595)
- “MyThread-1003” prio=1 tid=0x0850aac8 nid=0x1bad waiting on condition [0xa9fd0000..0xa9fd1120]
- at java.lang.Thread.sleep(Native Method)
- at test.ThreadDumpTest$TR.run(ThreadDumpTest.java:45)
- at java.lang.Thread.run(Thread.java:595)
- “MyThread-1002” prio=1 tid=0x085099b8 nid=0x1bac waiting on condition [0xaa051000..0xaa051fa0]
- at java.lang.Thread.sleep(Native Method)
- at test.ThreadDumpTest$TR.run(ThreadDumpTest.java:45)
- at java.lang.Thread.run(Thread.java:595)
- “MyThread-1001” prio=1 tid=0x08508a28 nid=0x1bab waiting
on condition [0xaa0d2000..0xaa0d3020] - at java.lang.Thread.sleep(Native Method)
- at test.ThreadDumpTest$TR.run(ThreadDumpTest.java:45)
- at java.lang.Thread.run(Thread.java:595)
- “MyThread-1000” prio=1 tid=0x08508520 nid=0x1baa waiting on condition [0xaa153000..0xaa153ea0]
- at java.lang.Thread.sleep(Native Method)
- at test.ThreadDumpTest$TR.run(ThreadDumpTest.java:45)
- at java.lang.Thread.run(Thread.java:595)
- “Low Memory Detector” daemon prio=1 tid=0x0843cf58 nid=0x1ba8 runnable [0x00000000..0x00000000]
- “CompilerThread0” daemon prio=1 tid=0x0843b930 nid=0x1ba7 waiting on condition [0x00000000..0xaa3eb808]
- “Signal Dispatcher” daemon prio=1 tid=0x0843a9d0 nid=0x1ba6 waiting on condition [0x00000000..0x00000000]
- “Finalizer” daemon prio=1 tid=0x08430740 nid=0x1ba5 in Object.wait() [0xaa52c000..0xaa52d120]
- at java.lang.Object.wait(Native Method)
- – waiting on <0xaa6b0848> (a java.lang.ref.ReferenceQueue$Lock)
- at java.lang.ref.ReferenceQueue.remove(ReferenceQueue.java:116)
- – locked <0xaa6b0848> (a java.lang.ref.ReferenceQueue$Lock)
- at java.lang.ref.ReferenceQueue.remove(ReferenceQueue.java:132)
- at java.lang.ref.Finalizer$FinalizerThread.run(Finalizer.java:159)
- “Reference Handler” daemon prio=1 tid=0x0842e898 nid=0x1ba4 in Object.wait() [0xaa5ad000..0xaa5adfa0]
- at java.lang.Object.wait(Native Method)
- – waiting on <0xaa6b0758> (a java.lang.ref.Reference$Lock)
- at java.lang.Object.wait(Object.java:474)
- at java.lang.ref.Reference$ReferenceHandler.run(Reference.java:116)
- – locked <0xaa6b0758> (a java.lang.ref.Reference$Lock)
- “VM Thread” prio=1 tid=0x0842bb68 nid=0x1ba3 runnable
- “VM Periodic Task Thread” prio=1 tid=0x0843e538 nid=0x1ba9 waiting on condition
Update : FYI : You can automatically take a thread dump of a Java application when a high CPU threshold is violated by using Applications Manager. Learn more orwatch a related video or download Applications Manager now.
Subscribe to:
Posts (Atom)